
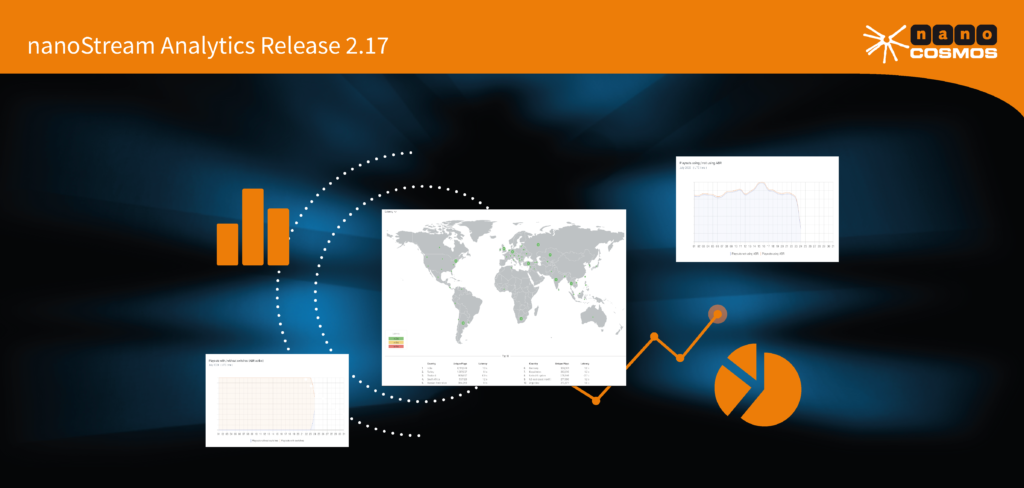
We have released nanoStream Analytics 2.17. The new release introduces a new feature that is available for multiple widgets and grants access to additional breakdowns. With one click customers can retrieve more detailed data on the different displayed information: Part of these widgets are e.g. about usage, playout/ingest and maximum concurrent viewers. The newly added breakdowns pop up to display the following top ten measures for the selected parameters: IP, stream name, country or e.g. city. Another widget is the world map that shows usage as part of a geographical breakdown. It now can be set to show ranking countries for e.g. playout/ingest, buffering play ratio, latency, playtime average, usage, ABR playtime, ABR viewer, abr switches, quality of experience. The newly added breakdowns enable stream providers to better understand changes of latency, playing time or e.g. stream quality, fluctuations and their cause based on respective parameters. Further details can be found in the nanoStream Analytics documentation and nanoStrem Analytics Zoom Feature documentation.
For those customers who are looking for additional insights regarding the quality of their service, complete and end-to-end, from the ingest to playback, we are also offering our Premium Analytics Service. This collects additional metrics from our web clients, the nanoStream H5Live Player and nanoStream Webcaster.
The Premium Analytics requires a business upgrade – we would like to invite you to contact us for details at sales@nanocosmos.de.
Changelog: Improvements/ Added Features
Added
- Zoom feature (breakdown for interesting chart datapoints) to widgets
- Home view:
- Maximum concurrent H5live viewers
- Month to Date
- H5live view:
- H5Live playback count per OS
- H5Live playback count per browser
- Average and median playing time in seconds
- Play buffering ratio in percent
- Player loading count per country
- Used player versions
- Average and median player latency in seconds
- Median play startup time in seconds
- Status/Error Codes
- Reasons for stopping
- Adaptive bitrate view:
- Playtime per ABR profile (video height)
- Viewers per ABR profile (video height)
- Switches success / fail
- Switches between ABR profiles
- Webcaster view:
- Webcaster publish count per OS
- Webcaster publish count per browser
- Status/Error Codes
- Average and median of video bitrate
- Average and median of audio bitrate
- World map view: just added Zoom hint
- Home view:
- Allow to get last ingest audio/video bitrate for multiple streams at once
- Now we provide 3 routes
/api/v1/monitoring/ingest/bitrate(returns audio + video bitrate)/api/v1/monitoring/ingest/bitrate/audio(returns just audio bitrate)/api/v1/monitoring/ingest/bitrate/video(returns just video bitrate)
- Max. 50 streams allowed
- Now we provide 3 routes
Improved
- StreamGuard: Accuracy of values has been increased, particularly for concurrency metric
- Functionalities of date time picker
- UX:
- Display message in widget when no data is available
- Display message in widget when request went wrong (e.g. no connection)
- Widget titles and descriptions have been modified for better understanding
- Widgets have been aligned according to height of each row
- Consistent look has been applied for widget headers
- Use thousand separators for all figures
- Switch pie chart to table when a lot of entries need to be shown
- Missing values displayed as zero in line charts are only shown between two available data points
- Total count on world map will not be rounded if the value is below 1e7
- Event filtering now available for H5live based world map metric and for adaptive bitrate view
Fixed
- Zoom for world maps
Playout/Ingestmetric to count only full sessions instead of every subsession (same approachPlayout/Ingestworld map metric works)
Added / Changed
- ‘Status/Error codes’ widget for webcaster
- ‘Used player/webcaster version’ to be switchable between pie chart and table view
- Assigned ‘Indonesia’ to Asia on world map
Documentation
Zoom Feature
https://docs.nanocosmos.de/docs/cloud/analytics-zoom
https://docs.nanocosmos.de/docs/cloud/analytics
nanoStream Cloud Analytics UI
https://metrics.nanocosmos.de/
Use your Bintu credentials to sign in or directly access from within the nanoStream Cloud Dashboard.
Please reach out to our team for further information or any questions: